Productivity Analytics for Transparent Teams
Turn work-hour, app, URL, screenshot, and project data into useful productivity visibility.
Turn work-hour, app, URL, screenshot, and project data into useful productivity visibility.
WHM brings together tracked time, non-productive usage, screenshots, websites, applications, attendance, and project reports so managers can identify bottlenecks and improve planning without micromanaging every update.
Review app and website usage with work-hour context.
Use screenshots and activity signals to understand real work progress.
Compare attendance, project time, and custom reports across users.
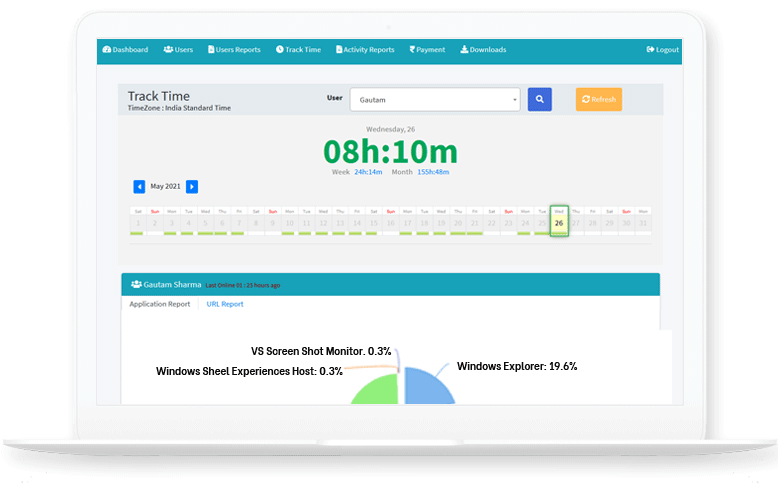
WHM turns raw tracking data into practical visibility for managers. Time totals show how long people worked, while screenshots, applications, websites, attendance, offline time, and project reports explain what happened during those hours.
WHM combines time totals, screenshots, app usage, website usage, attendance, offline time, and project reports.
WHM currently provides productivity visibility through reports and dashboards. A formal productivity score is listed for Phase 2 planning.
Managers, team leads, agencies, BPOs, remote teams, and small businesses can use WHM analytics for planning, coaching, and accountability.
Affordable workforce productivity tracking for growing teams. WHM helps companies review work hours, screenshots, apps, websites, projects, attendance, and reports with clear context.